What EEG is, and what it isn't: EEG from zero, lesson 1
- EEG
- EEG Beginner
- Neuroscience
- Data Engineering
- Time Series
Part 1 of 28 · Beginner · EEG from zero: the series
EEG records the brain's electrical activity from the scalp. It is very fast, but it can't say exactly where the activity comes from. This lesson explains what EEG measures, what it misses, and where it fits next to MRI, MEG and PET.
The one-sentence idea
EEG is a set of sensors on the scalp that stream the brain's voltage changes, many times a second.
Explain it simply
EEG stands for electroencephalography: electro (electric), encephalo (brain), graphy (writing). Small metal discs called electrodes sit on the scalp. Each one measures a tiny voltage, a few tens of microvolts (µV, millionths of a volt).
The German psychiatrist Hans Berger recorded the first human EEG in 1924 and published it in 1929. The idea has not changed since. What changed is the hardware, the number of channels and the software.
Think of a stadium. You stand outside with a few microphones on the walls. You hear the crowd roar the moment a goal is scored.
But you can't tell which seat each voice came from. EEG works the same way. It hears large groups of brain cells working together, in real time, from outside the skull.
For a data engineer, an EEG recording is a multichannel time series:
| EEG word | Data engineering view |
|---|---|
| Electrode | A sensor |
| Channel | One column: the voltage of one electrode against a reference point |
| Sampling rate | Rows per second, often 250 to 1,000 |
| Recording | A table with one column per channel and one row per time point |
| Events or annotations | Time-stamped labels, like log entries ("eyes closed", "seizure starts") |
Go one level deeper
What it measures. EEG mostly picks up currents in the cortex, the brain's outer layer. One cell's signal is far too small.
The scalp sees the sum of millions of cells that line up and work in step. Lesson 2 explains why.
What it is good at: time. Brain activity changes in milliseconds, and EEG follows it. A recording at 500 samples a second takes a reading every 2 ms.
What it is weak at: place. The signal passes through fluid, bone and skin before it reaches the electrode. On the way it spreads out over a wide patch of scalp.
So one electrode hears activity from several centimetres of cortex. Deep parts of the brain hardly show up at all.
What it isn't:
- Not a picture of the brain. CT and MRI show structure, like a photo. EEG shows activity over time, like a heart monitor.
- Not mind reading. It shows broad states, such as asleep or awake, eyes open or closed, or a burst of abnormal activity. It can't read thoughts.
- Not a single-cell recording. It hears big groups only.
- Not a full test on its own. Doctors read EEG together with symptoms, history and often scans. For example, a normal EEG does not rule out epilepsy.
Visual: how the tools compare
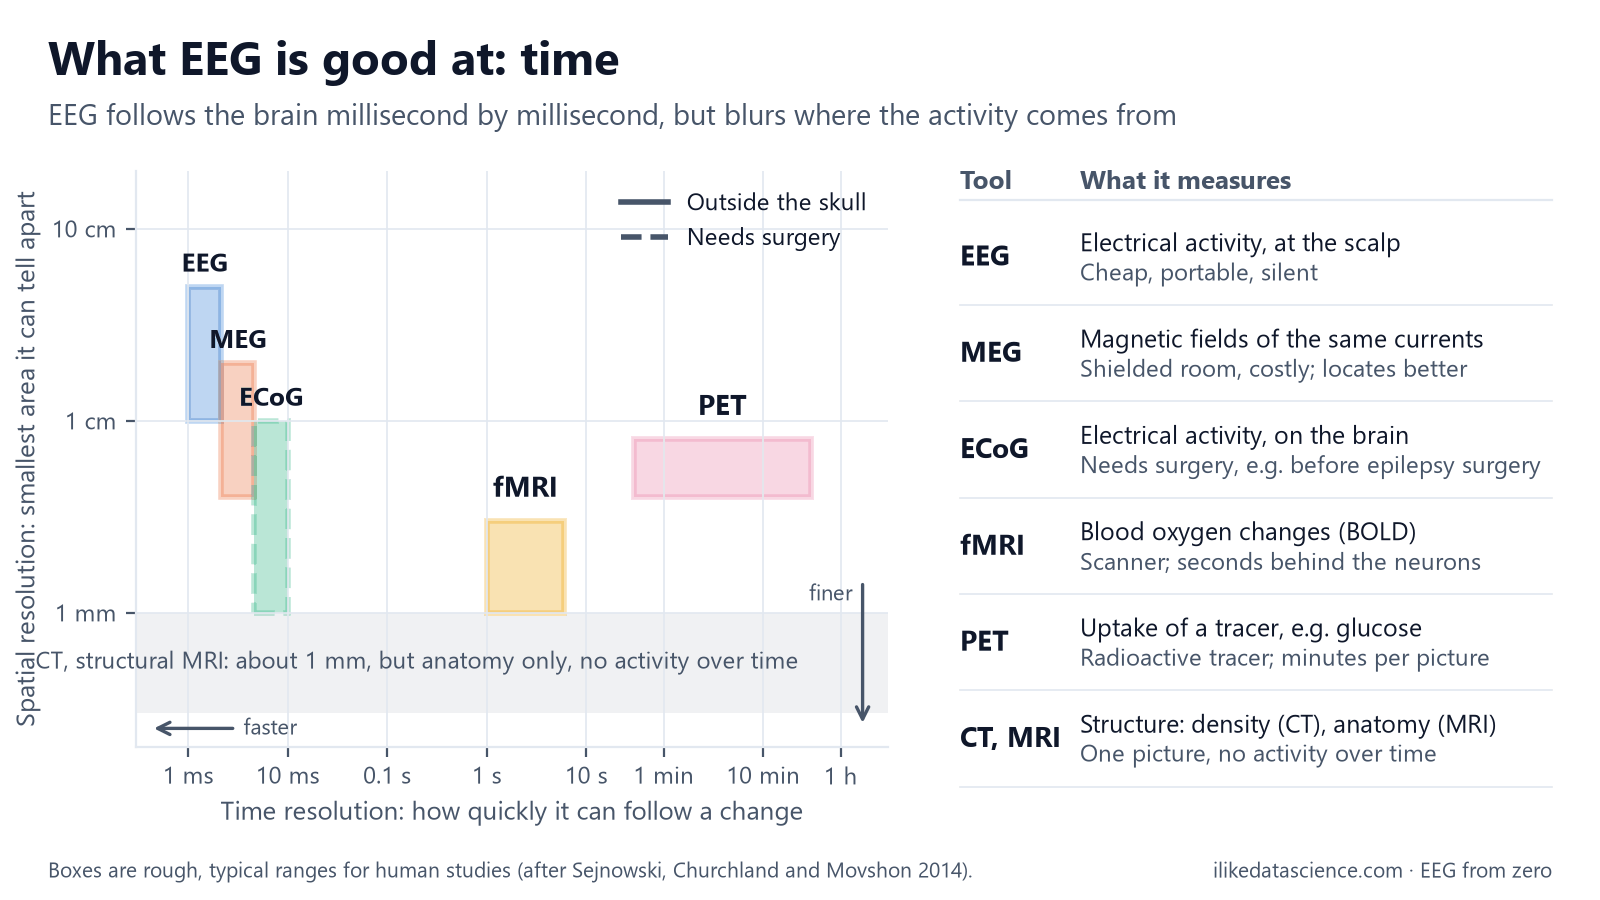
How to read it: further left means faster, lower means sharper in space. EEG sits far left but high up. fMRI and PET sit lower but much further right.
| Tool | What it measures | Speed | Place | Practical notes |
|---|---|---|---|---|
| EEG | Electrical activity at the scalp | Milliseconds | Centimetres | Cheap, portable, silent |
| MEG | Magnetic fields from the same currents | Milliseconds | Often better than EEG | Shielded room, costly |
| Intracranial EEG | Electrical activity on or in the brain | Milliseconds | Millimetres | Needs surgery |
| fMRI | Blood oxygen changes that follow activity | Seconds | Millimetres | Large scanner |
| PET | Uptake of an injected tracer, such as glucose | Minutes | Millimetres | Radioactive tracer |
| CT, MRI | Structure only | One snapshot | About 1 mm | No activity over time |
Why it matters for data analysis
- The data is big and fast. 64 channels at 1,000 samples a second for 1 hour is 230.4 million values. Stored as 16-bit numbers, as in the common EDF format, that is about 461 MB.
- Every channel is a mix. Each electrode hears many sources at once, plus noise. Much of EEG analysis is about separating them.
- Time is the strength. Features about rhythm and timing work well, such as power in a frequency band. Claims about exact brain locations need care.
- Labels are scarce. An expert has to mark events by hand, which is slow and costly. Expect small labelled datasets.
Key terms
| Term | Meaning |
|---|---|
| EEG | Electroencephalography: recording the brain's electrical activity from the scalp |
| Electrode | A small metal disc that picks up voltage |
| Channel | The signal of one electrode, measured against a reference point |
| Microvolt (µV) | A millionth of a volt; the scale of scalp EEG |
| Cortex | The brain's outer layer, where most of the EEG signal starts |
| Temporal resolution | How quickly a method can follow a change |
| Spatial resolution | How small an area a method can tell apart |
Check yourself
- Why can EEG tell when something happened better than where? Its readings come every few milliseconds, but the signal spreads out on its way through the skull and scalp.
- Which tool would you pick to see a brain tumour's shape, and why not EEG? MRI or CT. They show structure. EEG shows activity over time, not shape.
- A 32-channel recording runs at 256 samples a second for 10 minutes. How many values is that? 32 × 256 × 600 = 4,915,200 values, about 4.9 million.
Go further
- Biasiucci A., Franceschiello B., Murray M. M. (2019). Electroencephalography. Current Biology 29(3): R80–R85. A short, clear primer.
- MNE-Python: Overview of MEG/EEG analysis. Load and plot a real recording in Python.
- Nunez P. L., Srinivasan R. (2006). Electric Fields of the Brain: The Neurophysics of EEG, 2nd ed. Oxford University Press. The deep version.
For learning only, not medical advice.
Previous: The series and how to use it · Next: Neurons and electricity: where the signal comes from