"EEG from zero: a 28-lesson path from beginner to expert"
- EEG
- Neuroscience
- Data Engineering
- Machine Learning
- Time Series
The series hub · 28 lessons · beginner to expert
EEG from zero is a series of short lessons about EEG, the recording of the brain's electrical activity. It starts with "what is EEG?" and ends with you training your own EEG classifier.
I wrote it for people who know data but not the brain. If you build pipelines or models and the neuroscience words get in the way, start here.
Who it is for
- Data engineers and data scientists who are starting work on EEG data.
- Anyone who wants to know how brain signals become data a model can use.
You need some Python for the later lessons. You don't need any biology.
How each lesson works
Each lesson covers one idea and takes 5 to 10 minutes. They all follow the same shape:
- The one-sentence idea: what the lesson is about.
- Explain it simply: plain words, with an analogy from data engineering.
- Go one level deeper: the technical detail.
- A visual: a chart, a diagram or an animation.
- Why it matters for data analysis: where you will meet it in real datasets.
- Key terms: a short glossary.
- Check yourself: 3 questions, with answers.
- Go further: 1 to 3 trusted sources.
Each lesson ends with links to the previous lesson, this page and the next lesson.
The learning path
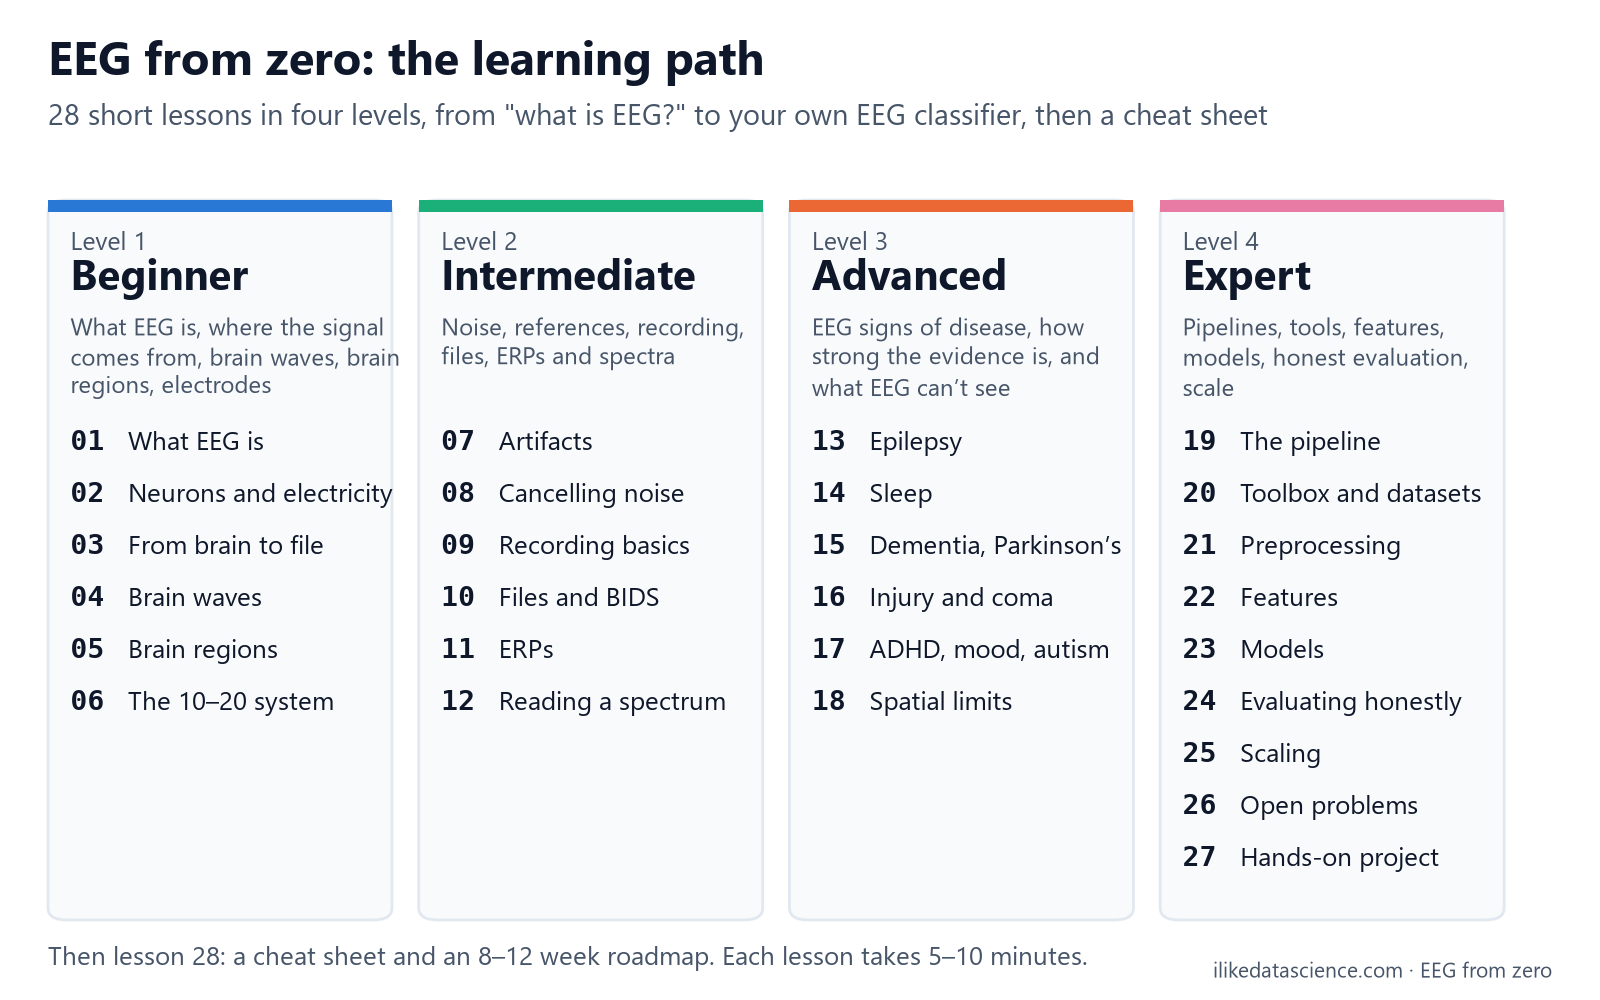
| Level | Lessons | At the end you can… |
|---|---|---|
| Beginner | 1–6 | Say what EEG measures and where it comes from, name the brain waves and regions, and read a channel name |
| Intermediate | 7–12 | Spot noise, explain references, choose a sampling rate, open an EEG file, and read a spectrum |
| Advanced | 13–18 | Describe the EEG signs of the main disorders, how strong the evidence is, and what EEG can't see |
| Expert | 19–27 | Build, test and run an EEG pipeline from end to end |
All lessons
New lessons are added level by level. A title becomes a link once its lesson is out.
Beginner
- What EEG is, and what it isn't
- Neurons and electricity: where the signal comes from
- From brain to file: the signal path
- Brain waves: delta, theta, alpha, beta, gamma
- The brain's regions and what they do
- Electrodes and the 10–20 system
Intermediate
- Noise and artifacts: blinks, muscle, heart, mains hum
- How noise is cancelled: amplifiers, references and montages
- Recording: sampling, Nyquist, impedance and devices
- EEG files and BIDS: a data engineer's view
- Event-related potentials: P300, N170, MMN
- Reading a spectrum: PSD, band power, spectrogram
Advanced
- Epilepsy: spikes, sharp waves and seizures
- Sleep: stages, spindles, K-complexes and apnea
- Dementia and Parkinson's: slowing and beta
- Brain injury, coma, stroke and brain death
- ADHD, depression, schizophrenia, autism: promising and debated markers
- Where does it come from? Spatial limits and source localization
Expert
- The EEG data pipeline from end to end
- The EEG toolbox: libraries and open datasets
- Preprocessing in practice
- Features: from band power to Riemannian covariance
- Models: from LDA and CSP to EEGNet and foundation models
- Evaluating honestly
- Scaling EEG data: storage, streaming, privacy, versioning
- Open problems and where data engineers can help
- Hands-on: your first EEG classifier with MNE-Python
Wrap-up
- Cheat sheet and an 8–12 week roadmap
How to use the series
- Go in order if EEG is new to you. Each lesson builds on the ones before.
- Answer the 3 questions at the end of each lesson before you move on.
- Try the code. The expert lessons link to a starter project you can run on a laptop.
A note on accuracy
Health claims get special care. Each claim about a disorder is marked as established, supported or research / debated, with a source. The pictures are drawn by code from simulated signals, unless a picture says it uses real data.
For learning only, not medical advice.
Start here: Lesson 1: What EEG is, and what it isn't